

Gini coefficient
Images

Gini Coefficient of Wealth InEquality source (2021)


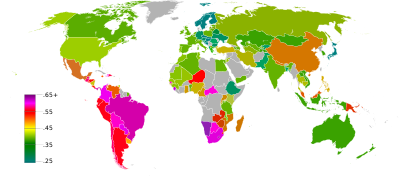


Deconstructing the Gini Coefficient
The Gini coefficient, a cornerstone metric in socio-economic analysis, provides a numerical representation of statistical dispersion, primarily applied to income, wealth, or consumption distributions within a population. Developed by Corrado Gini, it elegantly distills complex economic disparities into a single, digestible figure. A Gini coefficient of 0 signifies perfect equality, where every individual possesses identical income or wealth – a theoretical utopia.
Conversely, a coefficient of 1 (or 100%) denotes absolute inequality, a scenario where a single entity controls all resources, leaving the rest of the population with nothing. This scale allows for comparative analysis, enabling researchers and policymakers to gauge the extent of economic stratification across different societies and track its evolution over time. It's crucial to understand that this coefficient is not merely an academic exercise; it has profound implications for social stability, economic opportunity, and public policy formulation, serving as a vital indicator of a nation's economic health and fairness.
The Genesis of Inequality Measurement
The conceptualization of the Gini coefficient emerged from the pioneering work of Italian statistician and sociologist Corrado Gini, who introduced it in 1912. Gini's motivation stemmed from a desire to quantify the degree of inequality present in statistical distributions, particularly concerning income and wealth. He sought a robust mathematical framework that could capture the nuances of how resources were distributed among individuals.
His approach was groundbreaking, offering a more sophisticated method than simple averages or ranges to understand economic disparities. Gini's coefficient became a fundamental tool for economists and social scientists, providing a standardized and widely accepted metric for assessing economic justice and the impact of economic policies on different segments of society. His legacy lies in providing a quantifiable way to discuss and address one of the most persistent challenges in human societies.
The Societal Significance
The importance of the Gini coefficient extends far beyond academic curiosity; it is a critical barometer for societal well-being and stability. A persistently high Gini coefficient often correlates with increased social friction, reduced social mobility, and potential political instability. When wealth is concentrated in the hands of a few, it can lead to a sense of disenfranchisement among the majority, potentially fueling social unrest and undermining democratic processes.
Furthermore, high inequality can stifle economic growth by limiting the purchasing power of a large segment of the population and reducing investment in human capital, such as education and healthcare, for those who cannot afford it. Conversely, lower Gini coefficients are generally associated with more cohesive societies, greater access to opportunities, and more sustainable economic development. Policymakers worldwide monitor this metric to inform decisions on taxation, social welfare programs, and labor regulations, aiming to foster a more equitable distribution of economic benefits and promote long-term prosperity.
Global Perspectives
The Gini coefficient finds its most impactful application when examining real-world data from nations across the globe. For instance, in the late 20th century, OECD countries typically exhibited Gini coefficients ranging from approximately 0.24 to 0.49, indicating moderate levels of income inequality after accounting for taxes and transfers. Slovakia, for example, often recorded one of the lowest Gini coefficients, reflecting a relatively egalitarian income distribution. In stark contrast, some developing nations, particularly in Africa, have historically reported significantly higher pre-tax Gini coefficients, with South Africa frequently cited as having one of the world's highest, sometimes exceeding 0.63.
However, it is crucial to note the impact of policy interventions; social assistance and taxation can substantially reduce these figures, as seen in South Africa where the post-tax and transfer Gini coefficient drops considerably. Globally, the Gini coefficient for income in 2005 was estimated to be between 0.61 and 0.68, highlighting substantial worldwide disparity.
Navigating the Nuances
Despite its widespread utility, the Gini coefficient is not without its limitations, necessitating careful interpretation. A single Gini value can arise from vastly different income distribution curves, meaning two countries with identical coefficients might exhibit fundamentally different patterns of inequality. For example, demographic structures play a significant role.
An aging population or a high birth rate can artificially inflate the pre-tax Gini coefficient, even if the income distribution among the working-age population remains constant. This is because the elderly may have lower incomes due to retirement, and children do not earn income. To address these complexities, scholars have developed numerous variants and adjustments to the Gini coefficient, aiming to provide a more precise understanding by accounting for factors like age, household composition, and the lifecycle of income.
These refinements underscore the need for a multi-faceted approach when analyzing economic inequality.
See also
Frequently Asked Questions
What is the Gini coefficient?+
What does a Gini coefficient of 0 mean?+
What does a Gini coefficient of 1 mean?+
Who created the Gini coefficient and when?+
Why do people care about the Gini coefficient?+
Based on content from Wikipedia · Licensed under CC BY-SA 4.0