

Spacetime diagram
Images
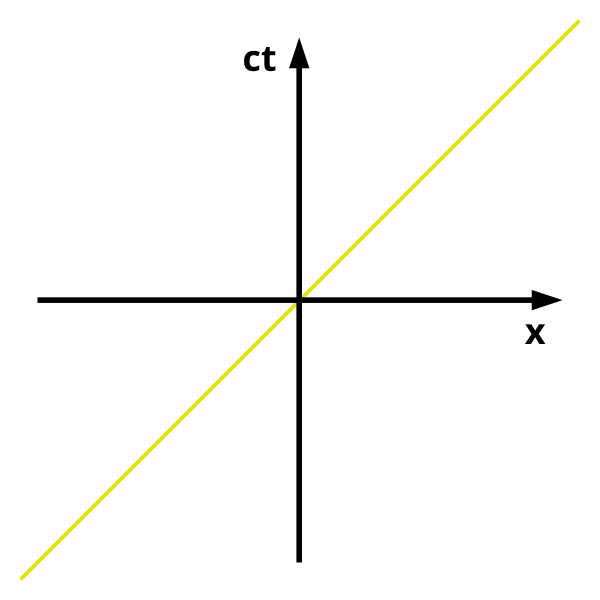
Spacetime diagram
The Geometric Language of Spacetime
Spacetime diagrams serve as indispensable graphical tools for visualizing the fundamental concepts of special relativity. Developed from the idea that space and time are interwoven into a four-dimensional continuum, these diagrams allow us to represent events – points in spacetime defined by a specific location and moment – in a simplified, often two-dimensional, format. The path an object takes through this continuum is its world line.
By plotting these world lines, we can geometrically understand phenomena like time dilation and length contraction, which are core predictions of Einstein's theory. These diagrams offer an intuitive, visual approach that bypasses the need for complex tensor calculus, making the abstract geometry of spacetime accessible for analysis and comprehension. They are not merely illustrative but are fundamental to the geometric interpretation of relativistic physics, revealing the structure of spacetime itself.
Minkowski's Revolution
Hermann Minkowski's groundbreaking work in 1908 introduced the concept of spacetime as a unified entity and provided the mathematical and geometric framework for its visualization. Minkowski diagrams, a specific class of spacetime diagrams, typically depict one spatial dimension against time. The elegance of these diagrams lies in their ability to represent physical laws geometrically.
A crucial convention is the scaling of units such that an object traveling at the speed of light traces a line at a 45-degree angle to the axes. This angle becomes a universal reference, a visual representation of the cosmic speed limit. The geometry of the diagram, particularly the slopes of world lines and the angles between them, directly encodes information about relative velocities and the invariant nature of the speed of light, fundamentally changing how physicists understood motion and the universe.
Relativistic Effects Geometrically
The profound significance of spacetime diagrams lies in their capacity to illustrate the non-intuitive consequences of special relativity. Phenomena such as time dilation, where time passes slower for a moving observer relative to a stationary one, and length contraction, where objects appear shorter in their direction of motion, can be directly visualized. For example, the difference in elapsed time between two events for different observers can be seen by comparing the lengths of their respective world lines projected onto the time axis.
Similarly, the spatial separation of events can be understood through geometric relationships on the diagram. This geometric interpretation allows physicists to explore the implications of relativity, test theoretical predictions, and develop a deeper understanding of the universe's fundamental structure without relying solely on algebraic manipulation.
The Geometry of Causality and Light Cones
Beyond illustrating basic relativistic effects, spacetime diagrams are crucial for understanding causality – the principle that an effect cannot precede its cause. The 'light cone' emanating from an event on a spacetime diagram represents the boundary of all possible future events that can be influenced by that event, and all past events that could have influenced it. Events within the light cone are causally connected, while those outside are not.
This concept is vital for understanding the structure of spacetime and the limits on information transfer. The 45-degree lines representing light speed are fundamental to defining these cones, illustrating how the speed of light dictates the causal relationships between events across the universe and forms the very fabric of our understanding of reality.
See also
Frequently Asked Questions
What is a spacetime diagram?+
Why do lines that are 45 degrees on a spacetime diagram represent light?+
How can a spacetime diagram help us see time dilation?+
What is a light cone in a spacetime diagram?+
How do spacetime diagrams show that space and time are connected?+
Based on content from Wikipedia · Licensed under CC BY-SA 4.0