

Population pyramid
Images

South Korea Population Pyramid



The Architecture of Demographics
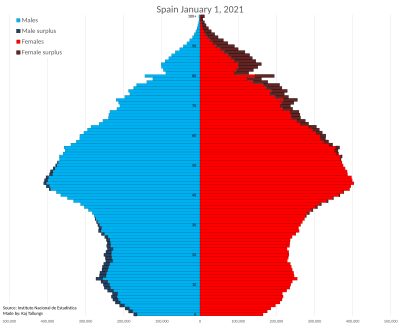
A population pyramid, also known as an age-sex pyramid, is a sophisticated graphical representation that illustrates the distribution of a population by age cohorts and sex. It functions as a visual snapshot of a country's or region's demographic composition. Typically, the horizontal axis represents the number or percentage of individuals, while the vertical axis denotes age groups, often in five-year intervals.
Males are conventionally depicted on the left, and females on the right. The resulting shape provides immediate insights into the population's structure: a broad base signifies a youthful population with high birth rates and potential for rapid growth, whereas a narrower base and wider middle or top suggest an aging population with lower fertility and increased life expectancy. This diagram is fundamental for demographers, sociologists, and policymakers to understand the current state and anticipate future population dynamics, including dependency ratios and potential labor force changes.
Historical Roots and Evolution of Demographic Visualization
While the practice of counting populations dates back to antiquity for administrative and military purposes, the systematic graphical representation of age and sex distributions, as embodied by the modern population pyramid, gained prominence in the late 19th and early 20th centuries. Early attempts at demographic charting existed, but the concept solidified with advancements in statistical methods and a growing interest in understanding societal trends. Figures like William Farr in Britain and later demographers utilized such charts to analyze mortality patterns, fertility rates, and migration.
The development of the pyramid format allowed for a more intuitive and comparative analysis of population structures across different regions and over time, becoming an indispensable tool for social science research and public policy formulation, particularly in the post-World War II era when population growth became a global concern.
The Strategic Imperative
The significance of population pyramids extends far beyond mere statistical representation; they are critical instruments for strategic planning and policy development across numerous sectors. For economic planning, understanding the proportion of the working-age population versus dependents (children and the elderly) is vital for forecasting labor supply, consumer demand, and tax revenues. In healthcare, a pyramid with a large elderly cohort necessitates planning for increased geriatric care, chronic disease management, and pension systems.
Conversely, a youthful population demands investment in education, child welfare, and job creation to prevent social instability. Furthermore, population pyramids can reveal the impact of historical events such as wars (leading to fewer males in certain age groups), baby booms (creating bulges), or significant migration waves. They are essential for resource allocation, infrastructure development, and anticipating social service needs.
Interpreting the Spectrum of Shapes
The shape of a population pyramid offers a narrative of a population's life cycle and historical context. An 'expansive' pyramid, characterized by a wide base and rapid tapering, indicates high fertility and mortality rates, typical of many developing nations experiencing population growth. A 'stationary' or 'columnar' pyramid, with roughly equal proportions across most age groups, suggests low fertility and low mortality rates, resulting in stable population growth, common in many developed countries.
A 'constrictive' pyramid, narrower at the base than in the middle, signifies declining fertility rates below the replacement level, leading to an aging population and potential future population decline. Variations, such as bulges or indentations, can point to specific demographic events like post-war baby booms, periods of increased or decreased birth rates, or significant emigration or immigration patterns.
Global Demography and Future Projections
Population pyramids are not static historical documents; they are dynamic tools used for projecting future demographic trends. By analyzing current age structures and fertility/mortality rates, demographers can forecast how a population's age distribution will change over decades. This predictive power is crucial for long-term planning in areas such as social security, retirement ages, and the future workforce.
Comparing pyramids globally allows for an understanding of differing stages of demographic transition and the associated challenges and opportunities. For instance, understanding the rapid youth bulge in some regions can inform strategies for education and employment to mitigate potential social unrest, while anticipating the needs of aging populations in others guides healthcare and pension reforms. The population pyramid remains a cornerstone for comprehending and shaping the future of human societies worldwide.
See also
Based on content from Wikipedia · Licensed under CC BY-SA 4.0