

Correlation: How Things Go Together!
Images
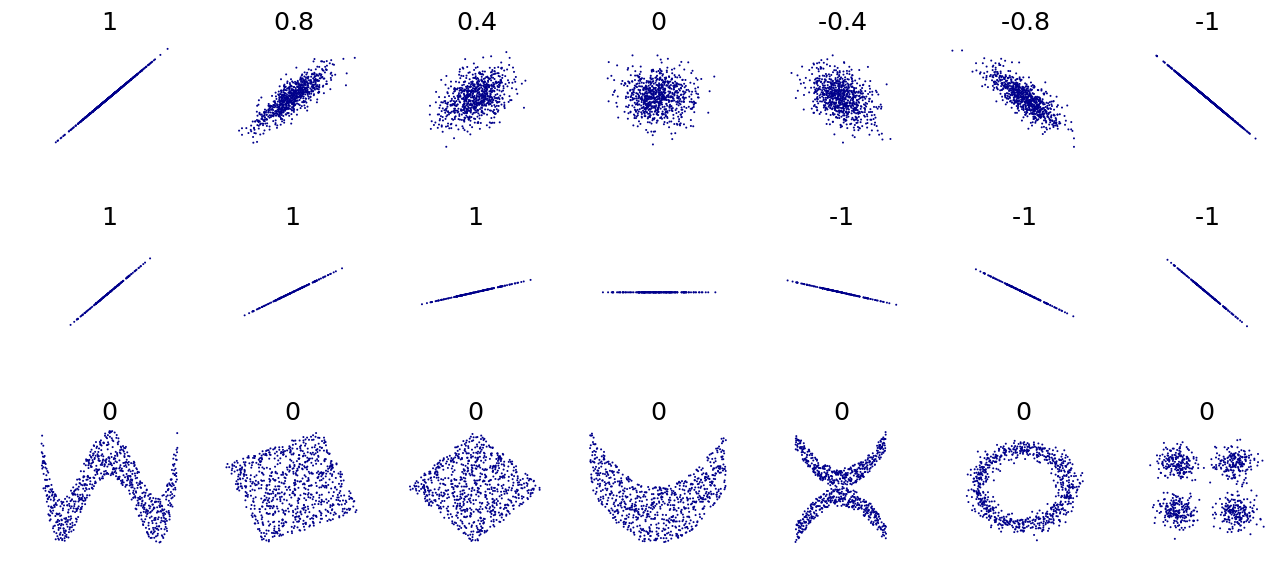
Correlation
The Nuances of Bivariate Association
Correlation quantifies the statistical relationship between two variables, indicating the extent to which they co-vary. It describes the direction and strength of a linear association. A positive correlation signifies that as one variable increases, the other tends to increase as well, while a negative correlation indicates that as one variable increases, the other tends to decrease.
The magnitude of the correlation is measured by the correlation coefficient, typically Pearson's r, which ranges from -1 (perfect negative linear correlation) to +1 (perfect positive linear correlation). A coefficient of 0 suggests no linear relationship between the variables. Understanding these nuances is crucial for interpreting data accurately and avoiding oversimplification of complex phenomena.
Evolution of Correlation
The conceptualization of correlation has evolved significantly over time. Early observations of co-occurring phenomena, like the link between lunar cycles and tides, were intuitive. However, the formalization of correlation as a statistical measure began in the late 19th century.
Sir Francis Galton, studying heredity, pioneered the concept of 'co-relation,' observing that traits in offspring tended to 'regress' toward the mean. Karl Pearson further developed these ideas, formulating the Pearson correlation coefficient (r) in 1896, providing a robust mathematical framework. This transition from qualitative observation to quantitative analysis marked a pivotal moment in statistical science, enabling more rigorous scientific investigation across disciplines.
The Indispensable Role of Correlation in Research and Prediction
Correlation is a foundational tool in numerous scientific fields, enabling researchers to identify potential relationships that warrant further investigation. In epidemiology, it helps identify risk factors for diseases by examining associations between lifestyle choices and health outcomes. In social sciences, it's used to explore connections between socioeconomic status and educational attainment, or between media consumption and public opinion.
Economists use correlation to model market behavior, predicting how changes in one economic indicator might affect others. While correlation itself does not prove causation, it serves as a critical first step in hypothesis generation, guiding experimental design and informing policy decisions by highlighting areas of significant association.
Methodologies for Assessing Linear Association
Assessing correlation typically involves graphical methods and statistical coefficients. Scatter plots are invaluable for visually inspecting the relationship between two continuous variables. They allow for the identification of linear trends, non-linear patterns, and the presence of outliers that might distort the correlation coefficient.
Pearson's r is the most common measure for linear correlation, assuming both variables are interval or ratio scale and their relationship is approximately linear. For ordinal data or when non-linear relationships are suspected, Spearman's rank correlation or Kendall's tau may be more appropriate. The statistical significance of a correlation coefficient is also assessed, typically through hypothesis testing, to determine if the observed association is likely due to chance.
The Critical Distinction
Perhaps the most crucial aspect of understanding correlation is recognizing its limitation: correlation does not imply causation. A strong correlation between two variables, X and Y, could arise from several scenarios: X causes Y, Y causes X, a third variable Z causes both X and Y (confounding), or the correlation is purely coincidental. For example, ice cream sales and drowning incidents are positively correlated, but neither causes the other; both are influenced by hot weather.
Mistaking correlation for causation can lead to flawed conclusions and ineffective interventions. Establishing causation requires controlled experiments or advanced causal inference methods that go beyond simple correlational analysis, involving manipulation of the independent variable and control for confounding factors.
Go deeper
Frequently Asked Questions
What does a positive correlation mean?+
What does a negative correlation mean?+
How do scientists measure how strong a correlation is?+
Why does a correlation not always mean one thing causes the other?+
What tools do scientists use to see if two things are correlated?+
Based on content from Wikipedia · Licensed under CC BY-SA 4.0